Using Data Visualization to Optimize Our Workspaces

data visualization workspace

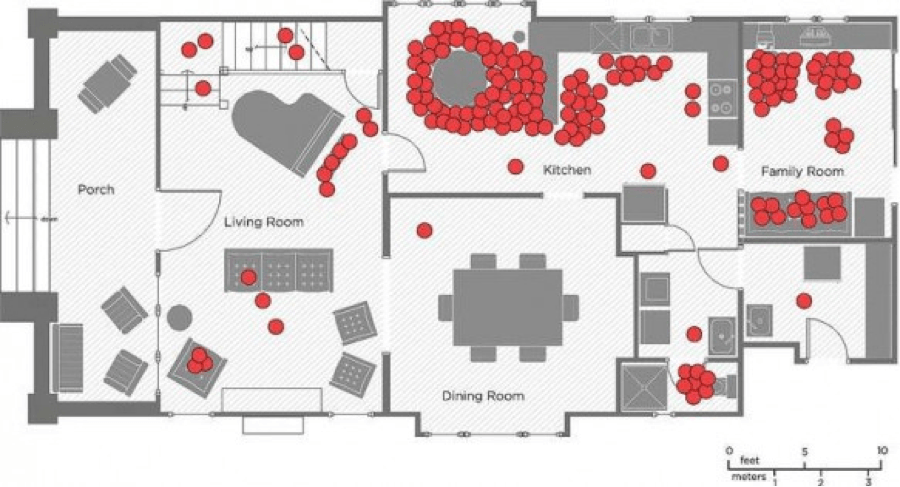
I recently came across an article on Life Edited that discussed a study of how families utilize the space in their homes.  The study tracked the movement of 32 families in the Los Angeles area over two days.

Each dot on the diagram below represents the location of one family member during a 10-minute interval.  Not surprisingly, most families spend much of their evenings congregating in the kitchen and family room and very little attention is given to the porch or dining room.  The article goes on to discuss how the space in homes could be optimized to accommodate the way families actually use it.

workspace visualization

This brings up some interesting parallels to organizational culture. What if we used data visualization to map the movement of people within our workspaces? What insights would we find?

Facilitating Collaboration

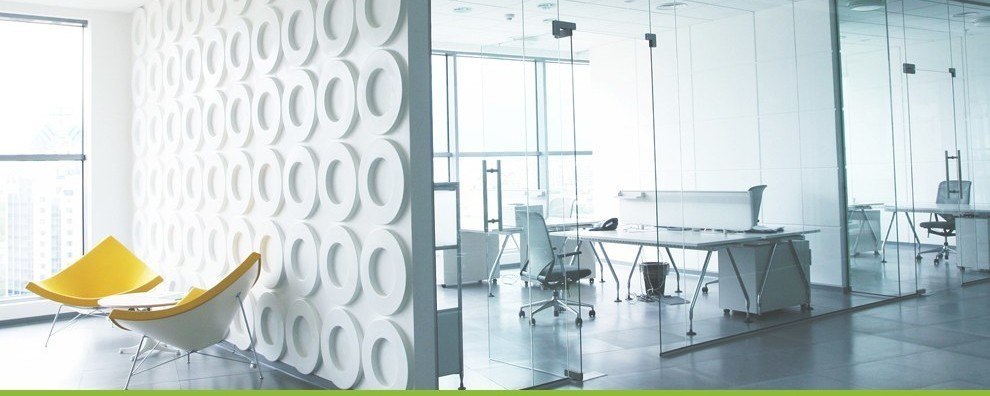
By applying the same principles laid out in the article, we would be able to determine which areas of our office are utilized more frequently.  For instance, maybe the shared kitchen space is a significant congregation area throughout the day, but conference room #2 is only use for 30 minutes in the afternoon.  At a very high level we can use this information to help design effective workspaces that facilitate communication and optimize the use of shared spaces.

Taking those insights further, we can explore how those workspaces are utilized. For instance, maybe the kitchen is not only a place to grab lunch but also where employees casually discuss business and some ideas they have for a new product line.  In this sense, the kitchen serves both as a source of camaraderie and a facilitator of innovation. This example may be a stretch, but it’s fairly easy to see how different spaces support different aspects of the organization’s culture.

These insights would help us identify the key hubs where the “actual work” (i.e. the side conversations, backroom deals, and brainstorming sessions that keep organizations moving) happens.

Enhancing Impact

From a leadership perspective, this information can help streamline and enhance the way organizations convey critical information.

By identifying the key congregation hubs and the type of discussions that are taking place, leaders now know where to place information (ex. update on a new safety policy), the content of the message (ie. use a humorous tone in the kitchen space), and the type of media to use (ex. quick graphic, display on a TV screen, a copy of the document, speaker announcement, etc.).  This could help improve the way information is disseminated and reduce the likelihood that coworkers are oversaturated with information that does not resonate well.

“Casual Collisions”: Applications in the Business World

Companies from Pixar to Google have taken a similar approach to developing workspaces. Their approach (or philosophy really) is called “casual collisions” where office space is configured to optimize collaboration and facilitate employee interactions.  As Steve Jobs once said “creativity comes from spontaneous meetings, from random discussions.  You run into someone, you ask what they’re doing, you say ‘wow,’ and soon you’re cooking up all sorts of ideas.”  Buildings, floors, hallways, and meeting spaces can all serve as a medium to foster creativity.

Google, while in the process of designing its new headquarters in 2013, felt that it was necessary to methodically plan out the configuration of the building to facilitate collaboration. To do this they conducted studies to determine how employees worked, what kind of spaces they preferred, and what groups/departments want to be close to each other. As a result, Google was able to configure the 1.1 million square foot building so that no employee would be more than a 2.5 minute walk from others they frequently collaborate with.

To push this concept further, an article published in the New York Times in 2013 provided a vision for the future, stipulating that through a combination of sensors, analytics, and technological improvements, offices could reconfigure each morning (by using sophisticated algorithms) to fill in structural gaps and place critical groups in closer proximity to address pressing tasks and challenges.

While that may seem like science fiction, there is evidence to suggest that more and more organizations are turning to analytics to figure out how to configure workspaces to ensure the right people are making connections.

Conclusion

It is likely that not every organization can conduct a study of this kind; factors such as costs, square footage, and geographic proximity of key departments can all limit the feasibility of this approach.

Still, data analytics can go a long ways to enhancing how we see our office spaces and can help leaders think more critically about how to improve organizational collaboration and communication to their team members through design.

Redefining Business As Usual: An Introduction To Orghacking

redefine business orghacking

Why is it that many large-scale change initiatives fall short of expectations?  Some might say it’s because leaders weren’t communicating the effort effectively. Others might say employees were stuck in a “business as usual” attitude. I would argue that the failure of many change efforts can be attributed to three factors:

  1. The organization didn’t target the right individuals
  2. The organization didn’t incentivize the change to match the values of its employees
  3. The organization tried to make the change too substantial rather than incremental

I’d like to offer an alternative approach that leverages insights from emergence, antifragility, and analytics to circumvent standard “top-down” strategies.

In recent years, the term “hacking” has grown in popularity, especially “growth hacking” within the marketing field.  Growth hacking involves using analytics to target specific consumer groups, test which messages are successful in driving viewership, and scale the most effective strategies.

This process can also be applied to implement organizational change, hence I’d like to term this alternative approach “orghacking.”

Orghacking offers a way to implement rapid, testable, repeatable, and scalable interventions that bypass conventional organizational limitations like hierarchy, stovepipes, and communications protocols. Each intervention caters to the values of key demographic groups and leverages the many social networks and relationships that exist among employees.

Changing Our Perspectives

Many large-scale change efforts see the world from a top-down perspective.  Leadership has an idea, they develop a policy to capture the idea, and they rely on managers to implement the policy at the ground level.  In this approach, information moves up through the hierarchical chain while decisions flow down.

The problem with this strategy is that it often fails to appreciate the complexities inherent within an organization.  Employees often interpret and respond to situations differently.  They may also interact and organize very differently across departments.  As a result, organizations function more as a network of clusters, where employees congregate around certain individuals and processes and share ideas and values with those closest to them.

orghacking0

A top-down approach may easily glaze over these factors, leading to unintended consequences such as employees misinterpreting the policy or outright ignoring it. The disconnect between top-down strategies and the way organizations inherently operate makes it difficult to align the workforce to a new strategy and vision.

Enter Orghacking

Orghacking, on the other hand, bypasses the standard top-down approach and instead moves from the focal point outward.

orghacking1

As the diagram above shows, orghacking involves a combination of process mapping and culture-based analytics to pinpoint what issues exist, where they occur, and who is involved. It then uses precise interventions to target hubs within the organization’s social networks, shape the intervention to tap into the influencers’ values to incentivize behaviors, allow the intervention to spread throughout the social network, measure its impact, and modify the approach.

In this way, orghacking flips conventional logic on its head by making interventions small in scope, targeted to the individual, and adaptable to new insights.

How does orghacking work?

Based on the diagram above, orghacking entails the following steps:

Step 1: Executing process mapping to understand challenges

One of the more succinct ways to identify bottlenecks is through process mapping. Process mapping allows us to see the flow of how products/deliverables are produced in an organization.

We can gauge how effective certain parts of the process are by obtaining feedback from focus groups, looking at financial data to assess returns, and examining process metrics to determine where delays occurred.

Through this approach, we can pinpoint specifically what challenges exist, what type of issue it is (people, process, tools related), and where it exists in the process.

Step 2: Leveraging analytics to discover insights about employees

Organizations are overflowing with data that can be used in orghacking.  Everything from personality indicators to satisfaction surveys give us insights into the different types of people who work at an organization, how they think, and what they value.

Depending on the level of granularity in the data, we can even look at correlations among the responses to identify connections among different sets of values/attitudes and demographics. Examples would be if people who rate the organization low on trust also tend to rate the organization low on delegating authority. Or, whether males in purchasing tend to rate the organization low on trust also tend to value clearly defined processes.

The goal is to identify hidden insights about our employees and find connections.  In the end, we can develop profiles for different types of people in our organization, each including a demographic indicator and one or more values/attitudes.

Step 3: Engaging in observation to understand how people organize

Emergence and self-organization are fundamental to how organizations operate.  Understanding how people organize to get work done is a key component of orghacking.

Observations can be conducted in-person by seeing who talks to whom and/or through data driven methods such as counting the number of individuals that enter a given room or office. Observations should be validated with employees (even anecdotally) to verify their accuracy and determine the context of the discussion, like why people are congregating around a specific person.  This helps us understand who are the key influencers in the organization that help move work forward.

Notionally, we assume that people congregate around others with similar values and perspectives, enabling influencers to spread ideas and permeate change.

Step 4: Using all three to create custom-tailored interventions

Orghacking is different from other approaches in that it aims to change the most fundamental units within organizations. Ultimately this comes down to identifying the influencers and those closely connected to them, communicating in their language, and developing incentives based on their profile to drive the desired change in behavior.  This can increase the likelihood that a message and intervention will stick.

Another difference is how interventions are implemented. Orghacking implements numerous bite-sized interventions that invoke small changes in someone’s behavior.

Each intervention is conducted using an A/B test approach, where there are intervention and control groups.  This allows us to estimate the impact and effectiveness of any one approach.  Since the change is small, it can be easier to assimilate, and follow-on interventions can be conducted in rapid succession. Interventions are also given time to work their way through the various social networks and will look different across groups.

For this reason, change occurs much more organically to the unique culture of a particular group or sub-group, allowing it to scale over time.

Finally, due to its small size and scope, the risks associated with any given intervention are fairly miniscule.  The failure of any one intervention does not jeopardize the whole effort.  In fact, failures give us ample opportunities to fine-tune our strategies.

Step 5: Gauging the impact of our interventions

It’s important to have a clear idea of the desired outcomes from an intervention.  Outcomes should be measurable, even with something as simple as a yes/no metric.  Outcomes help us determine whether an intervention was successful.  The lessons learned from this step allow us to determine what went wrong and make adjustments to improve the approach in the future.

Step 6: Adapting strategies based on lessons learned

While some approaches succeed, others will fail.  These opportunities enable us to modify our strategies to optimize the message and incentive.

Best practices within one intervention can be applied to others as well.  Eventually, we can fine-tune our approach to a set of key strategies that work for a given group, or even across groups. Then, we can broaden the outreach of the interventions to other hubs and influencers. Over time, larger segments of the organization will start exhibiting the desired outcomes and effectively internalize the change.

Repeat Steps 4-6 until the desired end-state is achieved

Coming Full Circle

The effectiveness of change ultimately depends on how it is packaged.  Orghacking uses micro targeting to fine-tune the package to better incentivize behaviors.  By doing so, it gives us a highly adaptable and effective way to systematically internalize change within our organizations.  In this way, it can be a preferable alternative to traditional top-down change strategies.

Mapping Team Effectiveness Through Data Visualization

Companies are taking creative measures to counter ‘meeting fatigue.’ From cutting meetings to a magic length (at Google, this is 50 minutes) to stand-up meetings (yes, standing vs. sitting), leaders are trying everything to improve efficiency and effectiveness of meetings.

Yet, how often do we still leave meetings dissatisfied with the outcome?  It was too long…didn’t result in a decision…was monopolized by one or two players…left attendees with more questions than answers.

Leaders know that good meetings are a product of good leadership. While there isn’t a one-size-fits-all formula for effective meetings, objective attention to the flow of your meetings is important for team development.

Mapping Opportunities With Data

We recently approached a client leadership team meeting as observers. Combining data-orientation with an eye to group dynamics, we plotted discussion milestones, determined topic frequency, and tracked specific players involved in the discussions that led to decision-making.  We then mapped the trajectory of the 2-hour discussion, broken into 10 minute increments.

The result is a data visual (see below), which we reviewed with the participants to better understand the conversation flow and decision making process. In the software, this content is linked. This enabled the participants to understand which conversations drove key milestones and which participants were involved in those decisions.

To see the fully interactive visualization, click here

Discussion_Overview

This model of provides a simple, but effective way to review what occurred during the meeting, pinpoint where the conversation may have moved in an unproductive direction, and identify opportunities to improve meetings. In the chart above, for example, the first 30 minutes were spent jumping from topic to topic. Only after 45 minutes did they start to discuss the connections between the topic areas.

Our meeting datafication pilot highlighted some important takeaways for the client’s leadership team. Here are 5 highlights:

1. Open with a check-in – Get it out on the table. Where is everyone mentally? In the course of their day? Are they ‘bought in’ to the topic at hand? Sharing an agenda pre-meeting with opportunity for attendees to provide feedback helps ensure everyone is satisfied with the game plan before they enter the room.

2. “Parking Lot” ideas They are good ideas, but they aren’t helpful for this conversation. Make note of any ideas to be rainchecked. They certainly shouldn’t be lost, but they also don’t need to derail this meeting’s conversation if they aren’t relevant to the agenda or decisions that need to be made.

3. Stay out of the weeds This is easier said than done. But when we reviewed our pilot meeting map with our clients, they were struck by the amount of time spent hashing out details.  A take-away after reviewing their discussion data was that they got stuck in the weeds when trying to come to consensus.  They settled on accepting 80% consensus and moving on rather than drowning in minutiae.

4. Hear from everyone If a certain participant’s point of view isn’t imperative to the discussion, they shouldn’t have been on the meeting invite. If you haven’t tapped all of the voices in the room, there could be critical data that isn’t being considered in decision making.  Be deliberate about inclusion.

5. Ensure actions have owners If participants walk away without specific actions and clear accountability, seemingly productive meetings will have little impact.  Regardless of whether there are tangible actions that need to take place or simply giving deeper individual thought to certain ideas, team members should leave meetings assured of their next steps.

Visualizing the discussion process prompts teams to reflect on their meeting effectiveness AND group dynamics, which will improve team effectiveness overall.

[starbox id=”Ashley Klecak,Stuart Farrand”]

Organizational Development: Balancing Analytics and Intuition

analytics and intuition

For years, businesses have relied on experience, trial and error, and heuristics to make decisions.  But, change is in the air. Data analytics has added a new dimension to the decision-making process, giving business leaders access to new, previously unavailable insights.

Unfortunately, there may be a split in the business world regarding its use.  While some are skeptical about the move toward analytics, others believe it should be the primary tool for business.  In both cases, they tend to miss the bigger picture.

Analytics was never intended to replace intuition, but to supplement it instead.

A Beautiful Combination

The beauty is in the combination. Analytics provides context to the insights that (most) business leaders already possess.

Two recent books help illustrate this point: The Second Machine Age: Work, Progress, and Prosperity in a Time of Brilliant Technologies, by Erik Brynjolfsson and Andrew McAffee, and Average Is Over: Powering America Beyond the Great Stagnation, by Tyler Cowen. Both provide a glimpse of the many ways technology will change the workplace over the course of this century.

Both books use the example of freestyle chess to demonstrate the potential of partnering human intuition with data processing.

For those who are not familiar, freestyle is a type of chess match where humans partner with computers and compete against each other.  Not surprisingly, there are many instances where computers have defeated a chess master. And yet, humans cooperating with computers have easily defeated both humans and computers acting alone.

The reason behind this is what’s interesting. Computers use probabilities to determine an optimal move.  Humans, on the other hand, rely on their experiences and intuition to identify opportunities and implement different strategies.  The computer provides the raw processing power, while the human provides a superior understanding of the game’s mechanics.

The freestyle chess example is a simple illustration, but it demonstrates something more complex for modern organizations seeking new direction: the potential of depolarizing analytics and intuition.

The Analytics Potential

Leveraging analytics, we can aggregate, process, and understand more information than was conceivable even 20 years ago. Analytics Training is a great way to be able to be able to reach your businesses highest potential as it will allow you to have the greatest understanding of how to read your results and invest that knowledge back into the business.

However, it’s important to note that analytics is based on models. In using it as a tool, we need to understand the basic assumptions and limitations of using a model, and use our intuition and experience to fill in the gaps and enhance the analysis process.

Organizational development is a field full of data. In many cases, there is too much information available for one individual to thoroughly digest, analyze, and interpret.  As in freestyle chess, analytics uncovers the trends, but the human in the mix determines which trends are most relevant. That’s how organizations come to understand which trends are worth further investigation.

By utilizing a broader set of tools through that balance, organizations can improve their ability to process information and understand the world within their walls.  It all comes down to balance. Rather than separating the qualitative from quantitative process from one another, organizational development should be informed by both data and intuition in order to drive the desired outcomes.

How Decentralizing Data Informs a Successful Organizational Culture

data decentralization

With the rapid adoption of technology into today’s organizational culture, data collection and analysis is becoming a common component of the way we do business. However, this new reliance on data brings a new host of challenges, including how to combine and share this information across the organization in order to get as much value out of it as possible.

Every department has unique data needs, and while it’s important to analyze the data for individual departments, managers and leadership need to aggregate departmental data to gauge the overall health of the organization.

There can be huge differences in how departments structure and format their data. So, while combining multiple data sources has significant advantages, the disjointed nature of departmental data formats has led some organizations to rely on a less than ideal “top down” or “one size fits all” approach to analysis.  In some cases this approach can work, but it often forces the organization to follow an architecture that reduces the data’s usefulness within each department.

Attempting to simplify the process by generalization may support the manager’s agenda, but the end results are not nearly as specific or as meaningful as they could be.

So, how can organizations ensure data and its analysis serves the greatest number of departments and people as possible, while still benefiting the business as a whole?  Below are several ideas to consider:

Determine which questions need to be answered.

First and foremost, data has to help us answer questions.  It is essential to clearly articulate which questions are more critical to managers and business units, and to ensure that data can be captured to support those.

Establish similar terminologies.

Despite the likelihood that each department has its own unique culture and terminology, organizations should strive to use a similar language across the board.  This will help promote cross-communication and maintain a certain degree of data integrity for managers.  Where this is not possible, organizations should develop a “translation table,” (i.e. a “Rosetta Stone” for the business) which can serve as the key to understanding the different terminologies.

Agree to a common set of core variables.

Each department has its own set of questions that will require a unique set of data, but managers need to address questions that span departments. To ensure they can, organizations should agree on a core set of variables that each department will collect.  This can be something as simple as time, location, identification number, costs, and labor hours, etc.  The key is to agree on how these variables will be defined and documented. Yes – that could require a bit of time and finesse. While this may be the most taxing part of the process, it is the most critical in the data decentralization process.

In an ideal world, individual departments and leadership would easily find a compromise for their various data needs.  On the one hand, each business silo need data that is specifically relevant to their operations. On the other hand, managers need data sets that address broader questions and issues. If the overriding concern is real usefulness in the data, the time it takes to create systems that allow for both will be well worth effort.

How is your organization decentralizing data to inform your culture?